Recent years have marked a period of unprecedented natural destruction in America. According to the National Oceanic and Atmospheric Administration, 16 natural disasters each caused at least $1 billion in damages in 2017 – contributing to the more than $300 billion total for the year. These figures reflect an uncommon series of tragedies: Hurricanes Harvey, Maria, and Irma struck in quick succession, followed by the largest wildfire in California's history and volcanic eruptions in Hawaii. But if this stretch has been exceptionally disastrous, how often do natural emergencies happen in a typical year, and where are they most likely to arise?
To investigate these questions, we turned to emergency declaration data from the Federal Emergency Management Agency, studying how frequently environmental threats emerge around the country. Our analysis presents records from 1953 to 2018 and explores the fluctuation of natural threats over the decades. To learn how frequently natural emergencies occur and which disasters are most likely to strike in your area, keep reading.
Natural Threats Across the Nation
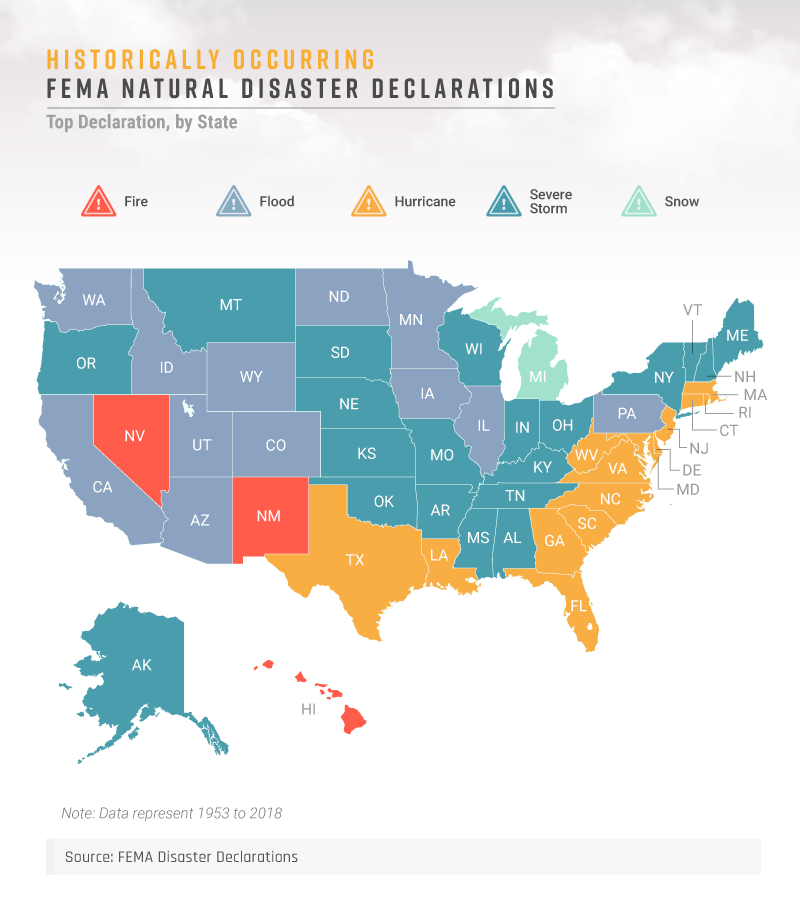
Our findings reveal the most pressing natural threats in each region of the country, as well as the states subject to the greatest number of declarations overall.
Hurricanes were the primary menace throughout much of the Eastern Seaboard, as well as in Louisiana and Texas, where Hurricane Harvey recently inflicted tens of billions of dollars in damage. More than the effects of severe wind and rain on homes and communities, these tropical storms can damage the country's economy, as one-third of the gross domestic product is produced in states along the Gulf and Atlantic coastlines, which are especially vulnerable to hurricane damage.
In California, flooding posed the greatest threat, although wildfires regularly ravage huge swaths of the state as well. Elsewhere, severe storms represented a recurring peril, especially in the Northeast and parts of the Midwest. Snow was the top cause of natural disasters in just one state: Michigan.
Emergency Areas
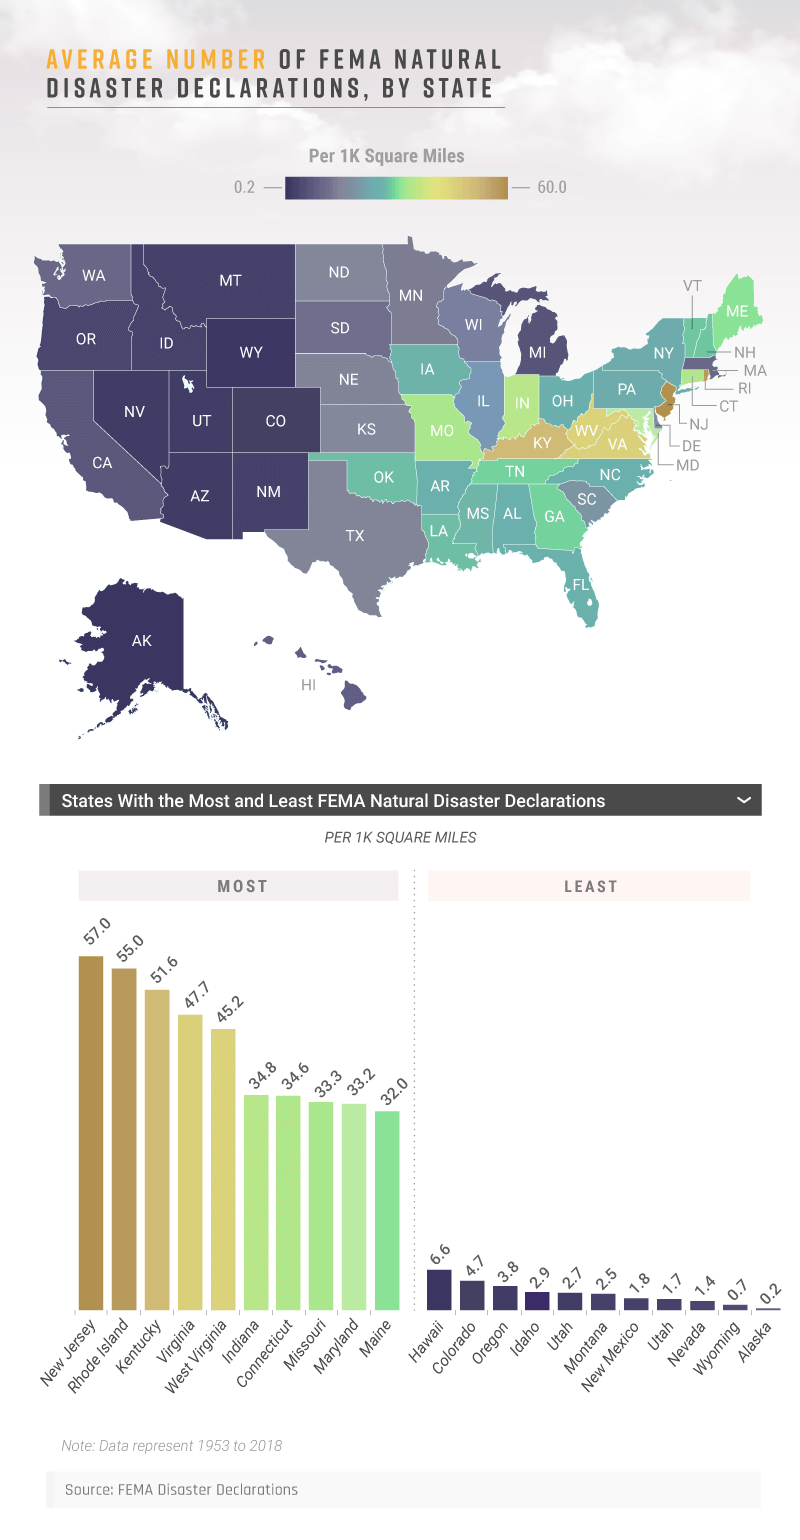
To gauge the prevalence of disasters across the country, we measured the number of declarations against the geographical size of each state.
Two smaller Northeastern states, New Jersey and Rhode Island, topped our list. In both places, coastal exposure makes hurricanes the most common threat. Hurricane Sandy moved through much of New Jersey in 2012, impacting as many as 50,000 families who lost their homes to the storm. More than five years later, some residents are still struggling to get over the emotional and economic effects of the storm. In 2017, roughly 1,200 property owners were still in the process of seeking and receiving damages from both government aid and insurance claims for their sustained property losses.
Conversely, Alaska and Wyoming had the fewest declarations per 1,000 square miles during the period studied. Additionally, many Western and Southwestern states contended with few disasters relative to their size: Nevada, Arizona, and Utah ranked in the bottom five.
Top States for Severity, by Disaster Type
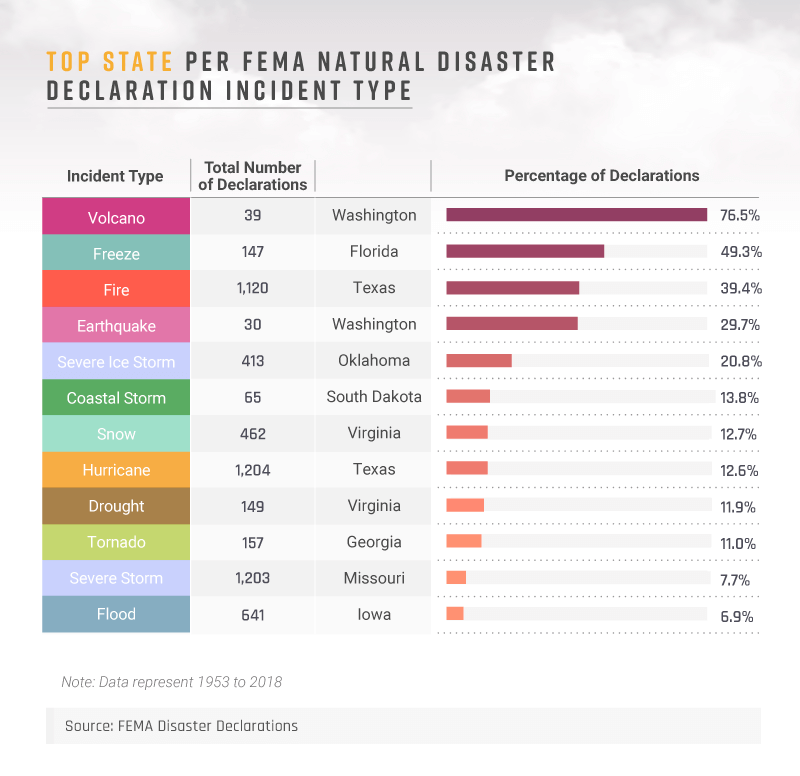
When we consider which states have declared various emergencies most frequently, our findings may seem counterintuitive at first. Balmy Florida led all other states in freezing declarations, and Oklahoma had the greatest number of ice storm emergencies. These findings relate to a lack of preparedness for uncommon weather conditions: Residents' homes may not be adequately insulated for cold temperatures, for example. Other findings indicate threats unfamiliar to most out-of-staters. Washington is home to no fewer than five active volcanoes and leads all other states in volcano-related disaster declarations accordingly.
In keeping with our earlier findings, Texas led in multiple categories, recording the greatest number of droughts, fires, and hurricanes. Meanwhile, Missouri had the most severe storm declarations, with more than 1,200 in total. Iowa led in the flood category, a perennial plague in many areas of the state, including its major cities. Virginia took the top spot for snow, whereas Georgia led all other states in tornado-related emergencies.
Disaster-Related Crises, by County
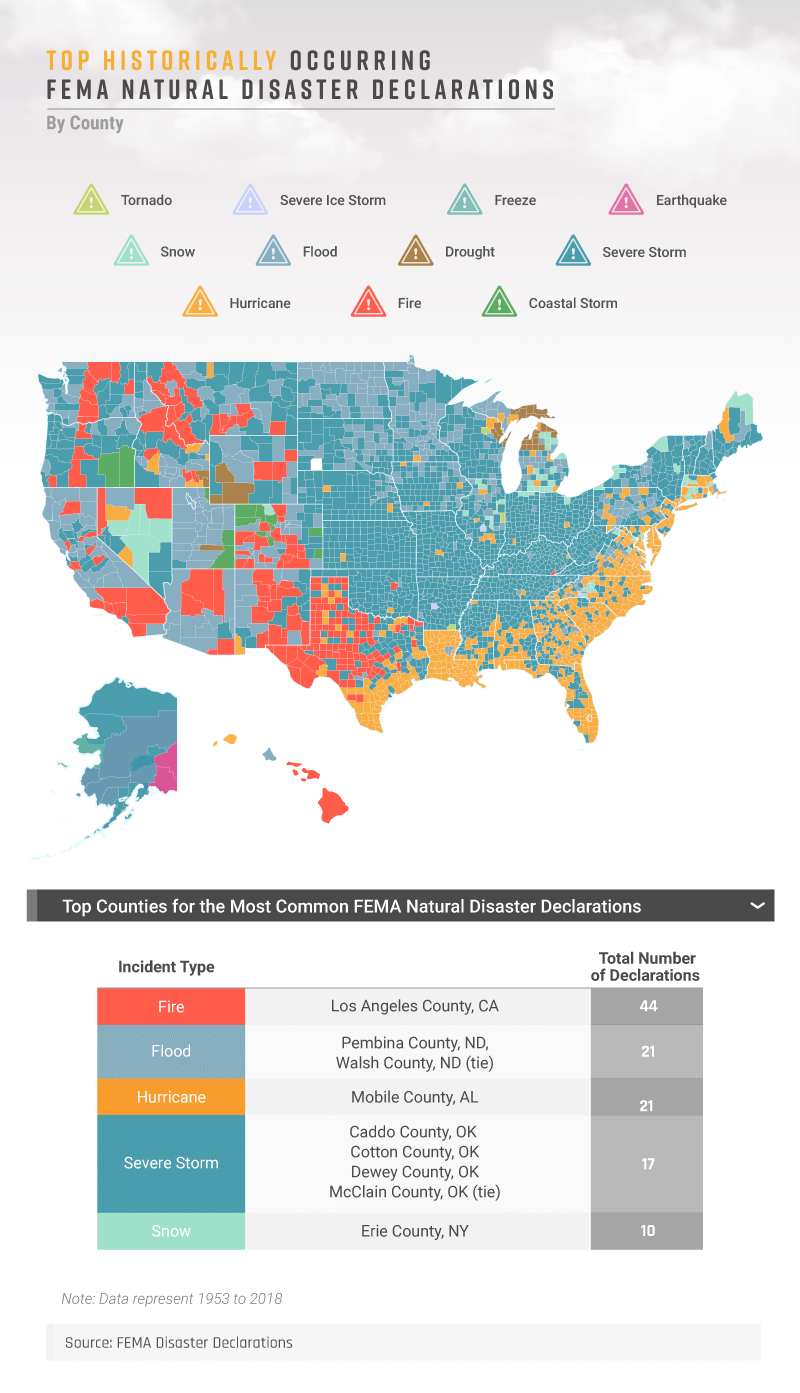
Some places were particularly disposed to certain threats, such as Los Angeles County, where the threat of wildfires is more or less ever-present. Even if you don't live in LA proper, the effects of these fires are seriously widespread. In 2017, one fire burned through 65,000 acres in three days, contaminating the air quality with harmful toxins throughout much of Southern California. Even being exposed to these pollutants for a few hours can cause smoke-related illnesses, and the longer a person breathes in air contaminated by wildfires, the more dangerous it can become.
In Oklahoma, four counties tied for the greatest number of severe storm incidents in the nation. Alabama's Mobile County had the highest total of hurricane disaster declarations, representing the area that borders the Gulf of Mexico. Two North Dakota counties experienced flooding disasters most frequently, and chilly Erie County, New York, had the greatest number of declarations related to snow.
Local Catastrophes
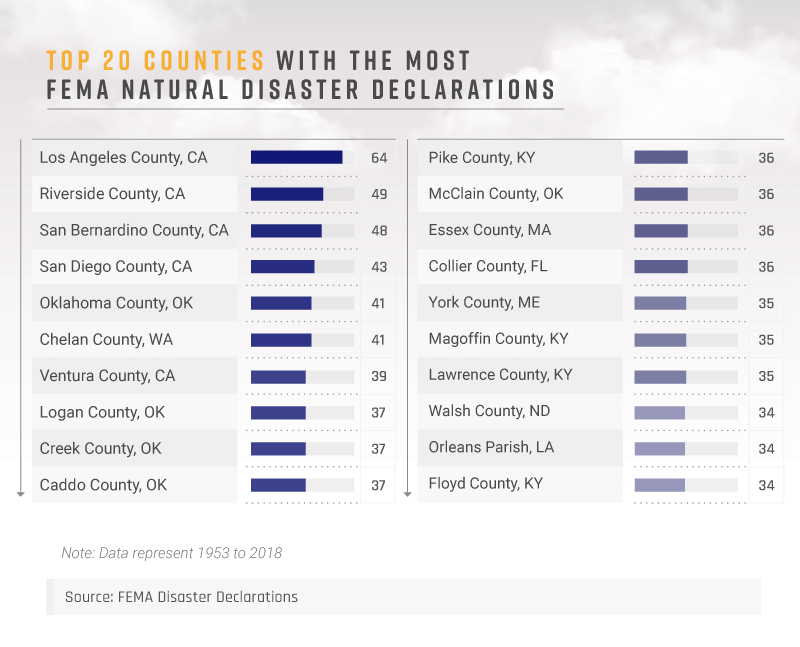
To consider the impact of weather-related dangers more closely, we did a more in-depth study of natural disaster declarations at the county level. Each of the top three counties – Los Angeles, San Bernardino, and Riverside – belong to a portion of Southern California that is notoriously prone to a variety of natural threats, including wildfires and mudslides. Nearby San Diego County, which ranked fourth in total disaster declarations, faces a similar confluence of challenges, including earthquakes and major flooding.
Oklahoma also had several disaster-prone counties of its own: five of the top 12 counties belonged to the Sooner State, despite being a much smaller state than California. Fifth-ranked Oklahoma County includes Oklahoma City, considered one of the most dangerous major cities for natural disasters in America. Kentucky also possessed four of the top 20 counties nationwide for disaster declarations. These included Pike, Magoffin, Lawrence and Floyd counties, which have recently endured severe storms, floods, and landslides.
Disaster Costs: Fiscal and Fatal
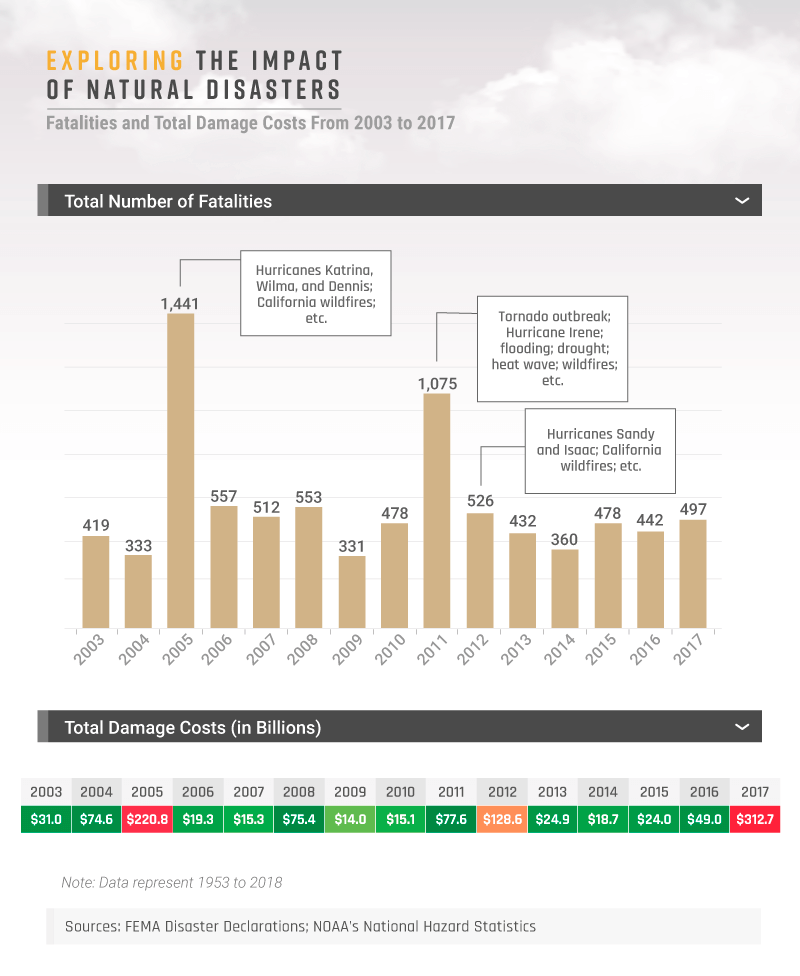
These metrics suggest just how much disaster destruction varies on an annual basis, in terms of both decimated property and the loss of human life. Additionally, disaster-related deaths and hefty property destruction don't necessarily rise and fall in tandem. For example, 2006 and 2008 witnessed approximately the same number of fatalities, but damage costs were more than three times as large in the latter year. Similarly, 2012 had the third-highest damage cost (thanks to a $71 billion contribution from Hurricane Sandy), but the number of deaths was only slightly higher than the average that year.
One year exceeds all others in terms of lives lost due to natural disasters: Due to Hurricane Katrina and California wildfires, 2005 witnessed the most casualties by far. With a combined 1,441 fatalities, 2005 was nearly three times as deadly as any year in the decade that followed save for one exception. 2011 saw a devastating mix of separate catastrophes occur across the country leading to 1,075 deaths. These included Hurricane Irene, which caused 41 deaths, and a massive tornado in Joplin, Missouri, which claimed 161 lives. Apart from fatalities, the disaster-intensive 2017 ranked first in terms of cost, with more than $312.7 billion in natural disaster damages.
Natural Disaster Breakdown
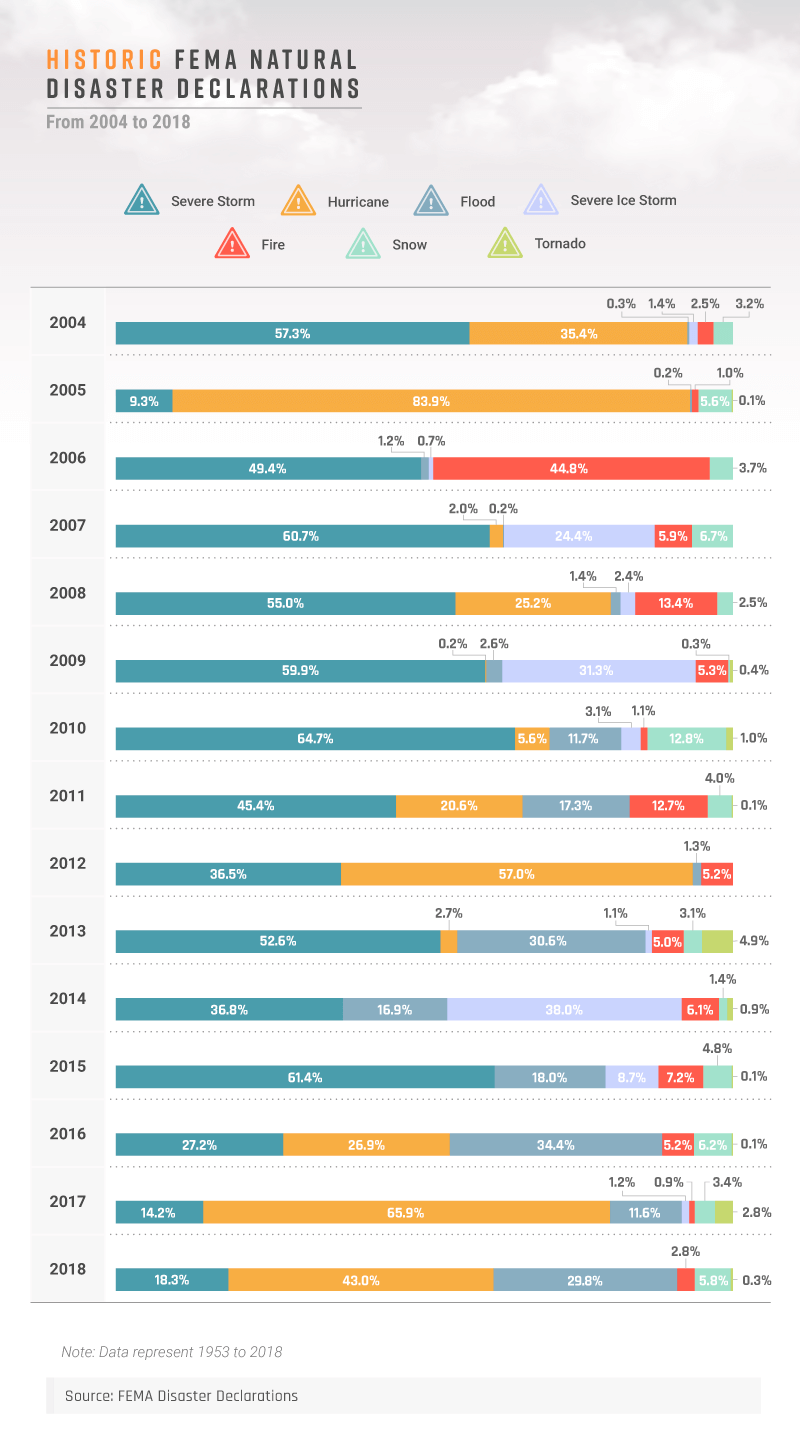
Each year entails a distinct mix of natural threats, but severe storms were the dominant concern during the period studied. In nine of the 15 years analyzed, severe storms accounted for more declarations than any other natural threat. Other disasters struck less consistently but caused grave trouble when they did. In 2006, a year in which a record-breaking number of wildfires occurred, fires accounted for about 45 percent of all disaster declarations. In 2016, when the U.S. experienced an unprecedented 19 separate floods, more than a third of all disaster declarations concerned flooding. In our 2018 data, floods accounted for a similar portion of declarations nationwide.
In some years, our data reflects the impact of a single disaster: In 2012, when Hurricane Sandy menaced much of the Northeast, 57 percent of declarations concerned hurricanes. In 2005, when Hurricane Katrina menaced the Gulf of Mexico, more than four in five declarations pertained to hurricane threats. While Katrina is synonymous with the devastation of New Orleans specifically, the storm also pummeled large areas of Mississippi and Alabama. Some 90,000 square miles of the country were eventually affected, and hundreds of thousands of people were forced to evacuate their homes.
A Decade of Disaster Data
This animated presentation illustrates the development of natural disaster concerns over time, both at the national level and within specific states. For example, the prevalence of fire declarations in 2006 seems concentrated in Texas, where a series of blazes consumed nearly a million acres of land. Other patterns recur annually and are more broadly visible from coast to coast. One such risk is flooding: In the warmer months of spring and summer, a number of factors contribute to intense precipitation and flash floods across the country.
Hurricanes represent another seasonal threat: Although hurricane season officially spans from June until the end of November, most experts view August, September, and October as the most dangerous stretch of the year. Tornado season peaks slightly earlier, with the highest volume of twisters coming in April, May, and June, and winter certainly ushers in severe weather of its own. As the months and years pass by, our data present great variation in natural disasters, but very few times in which nature's threats relent entirely. To learn more about natural disaster declarations in your county and state, use our interactive map.
Expecting the Unexpected
Our results indicate which regions have endured the most destruction at nature's hands in recent years, and which kinds of disasters are most common and catastrophic. While these insights are valuable in anticipating future challenges, many natural threats defy precise prediction. Compelling as they may be, our historical data cannot reveal what the coming months and years will bring. Rather, they simply confirm the value of preparation: Communities around the country must plan for extreme weather, however remote the possibility may seem.
Although natural threats are often beyond our control, every family deserves the chance to protect their home from destruction and danger. With decades of experience keeping Americans safe, ADT employs the latest technology to keep you comfortable and confident at home. From smoke and carbon monoxide detectors to comprehensive home security services, we offer the best tools and service to keep you as safe as possible.
Methodology
We studied FEMA Disaster Declarations data, which collects information on historic disaster declarations from 1953 to 2018. We also examined data from NOAA's National Hazard Statistics, which collects information on the impact of disasters (such as injuries and fatalities) from 1996 to 2017. We also examined data from NOAA National Centers for Environmental Information (NCEI) U.S. Billion Dollar Weather and Climate Disasters (2018). FEMA data was collected in January 2019. NOAA data was collected in October 2018.
Sources
- https://www.vox.com/energy-and-environment/2017/12/28/16795490/natural-disasters-2017-hurricanes-wildfires-heat-climate-change-cost-deaths
- https://www.cnn.com/2018/06/02/us/thomas-fire-officially-out/index.html
- https://www.newsweek.com/kilauea-hawaii-hydrovolcanic-explosion-eruption-magma-water-ocean-1037364
- https://www.fema.gov/
- https://www.cbsnews.com/news/the-wrath-of-hurricane-harvey/
- https://www.thebalance.com/hurricane-damage-economic-costs-4150369
- https://slate.com/technology/2018/07/california-wildfires-a-timeline-of-the-biggest-blazes-in-recent-history.html
- https://www.nj.com/ocean/index.ssf/2017/10/the_fallout_from_hurricane_sandy_5_years_later.html
- https://www.weather.gov/mfl/about_cold
- https://www.seattletimes.com/seattle-news/burning-questions-about-washington-states-5-active-volcanoes-scientists-answer-them-today/
- https://www.desmoinesregister.com/story/news/2018/06/12/iowa-flooding-2008-look-back-officials-admit-downtown-des-moines-could-flood/690388002/
- https://la.curbed.com/2018/6/5/17428734/wildfires-calfornia-risk-prediction
- https://www.worldatlas.com/na/us/al/c-baldwin-county-alabama.html
- https://www.worldatlas.com/na/us/al/c-mobile-county-alabama.html
- http://nymag.com/daily/intelligencer/2018/01/mudslides-are-the-latest-natural-disaster-to-hit-california.html
- http://www.sandiegouniontribune.com/news/politics/sd-me-hazard-website-20170731-story.html
- https://www.prnewswire.com/news-releases/avoid-natural-disasters-bestplaces-reveals-the-top-10-safest-places-to-live-300543000.html
- https://www.fema.gov/news-release/2018/04/12/president-donald-j-trump-approves-major-disaster-declaration-kentucky
- https://www.businessinsider.com/most-destructive-hurricanes-in-us-history-2017-8#hurricane-sandy-2012-714-billion-14
- https://weather.com/safety/hurricane/news/us-deaths-hurricanes-tropical-storms-nhc-study
- https://www.kansascity.com/news/state/missouri/article211603864.html
- https://www.cnbc.com/2017/12/26/2017--a-year-of-disaster.html
- https://www.ncdc.noaa.gov/sotc/fire/201806
- https://www.usatoday.com/story/weather/2017/01/04/floods-natural-disasters-2016/96120150/
- https://www.cnn.com/2013/07/13/world/americas/hurricane-sandy-fast-facts/index.html
- https://www.history.com/topics/hurricane-katrina
- https://www.expressnews.com/business/national/article/Texas-wildfire-damages-estimated-to-be-at-least-11005058.php
- https://weather.com/safety/floods/news/2018-05-04-flash-flood-season-spring-summer-factors
- https://www.livescience.com/57671-hurricane-season.html
- https://weather.com/storms/tornado/news/2018-03-27-april-may-june-tornadoes-peak-months
Fair Use Statement
If you'd like to share our findings of the prevalence of natural disasters nationwide, you're welcome to do so for noncommercial purposes. If you do choose to share this project, we simply ask that you include a link to this page to attribute our team for our work.
This information is provided for general informational purposes only and should not be relied on in making any buying decisions. Natural disaster information provided by FEMA. Copyright © 2019 FEMA. Information is deemed reliable but not guaranteed.
© 2019 ADT LLC dba ADT Security Services. All rights reserved. ADT, the ADT logo, ADT Always There and 800.ADT.ASAP and the product/service names listed in this document are marks and/or registered marks. Third party marks are the property of their respective owners.